The model looks at the previous election outcome in each of the 50 states and projects an outcome for them based on three additional factors:
- Monthly national head-to-head polling between the two major party candidates
- Home State Advantage
- Regime age (i.e. how long the incumbent party has held the White House)
I can then extrapolate the projected state-level results up to the national-level for both the popular vote (by taking a turnout-weighted sum of each state's contribution to the national-level total) and the Electoral College total (by awarding each state's Electoral College votes to the candidate that the model projects will win it).
It is also possible to calculate a win-probability for each state based on the model's projected outcomes. Not all states are equal. Some states are just more likely to be won by one party's candidate over another. Simply put, it's highly likely that a Democrat will win states like California, Massachusetts, and Illinois, and that a Republican will win states like Wyoming, North Dakota, and Alabama. Other states are more likely to be considered battleground states like Florida, Arizona and Ohio.
Using these win-probabilities, I can run simulated elections to see who will win and who will lose, while taking into account a certain amount of uncertainty in the state-level outcomes. I had the computer do that 100,000 times. I present the results of that analysis in the table below. In those 100,000 simulated elections, Joe Biden won the national popular vote in every single one of them, and the Electoral College in 99,503 times. Donald Trump's 400+ victories all came as a result of an Electoral College misfire, just as it did in 2016.
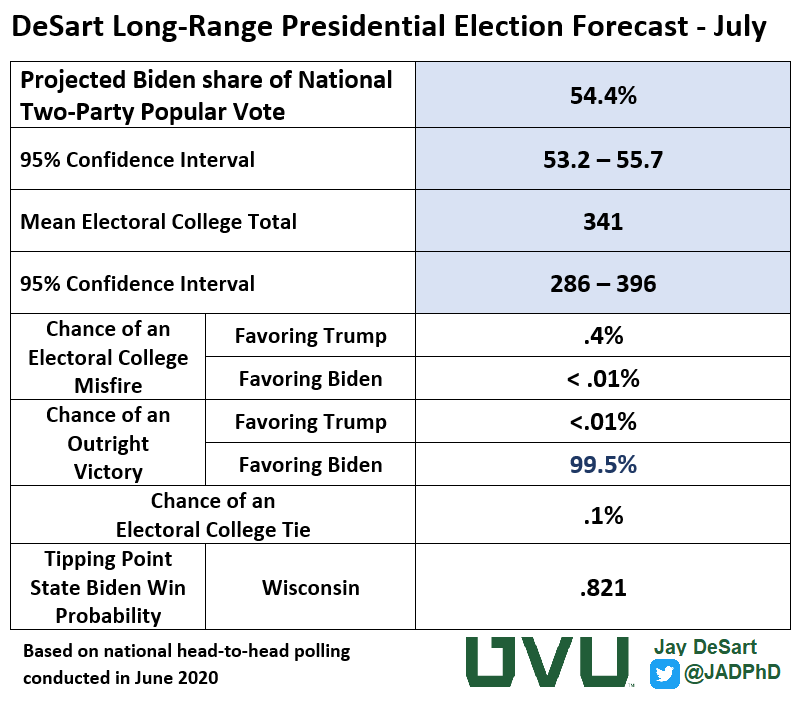
Beyond the election simulations, the key statistic for me is what can be called the "tipping point state." This is the state that, when you arrange them all based on their likelihood that they'll be won by one candidate over the other, will be the one that puts either one over the top and give them the 270 votes needed in the Electoral College in order to win a majority.
The model suggests, as can be seen in the figure below, that Wisconsin is that state. Right now, the model suggests that Joe Biden has an 82.1% chance of winning Wisconsin. From a strictly statistical perspective, that's not high enough to be "certain." Us statistics nerds like to see a likelihood above 90-95% for us to have confidence. But it certainly is suggesting that it is more likely than not to happen.

For comparison sake, at this point in 2016 this model was projecting a very close election, but gave Trump a 65.9% chance of winning the Electoral College, which of course he did. This was in spite of the fact that Hillary Clinton held substantial leads in the national head-to-head polling in June of 2016.
The context of 2020 is substantively different than that of 2016. You don't have a party attempting to hold on to the White House for a third consecutive term, which is notoriously difficult to do. Instead, we've got an embattled President running for re-election after winning a close election four years earlier, and doing so with a discrepant outcome between the national popular vote and Electoral College.
Of course something could happen between now and November that could alter the trajectory of the race. We saw that in 2016. Until that happens, however, this model suggests that it doesn't seem likely that Donald Trump will be successful in winning a second term.
But if and when that happens, I'll be there looking at the numbers, because that's what a nerd does.
But if and when that happens, I'll be there looking at the numbers, because that's what a nerd does.