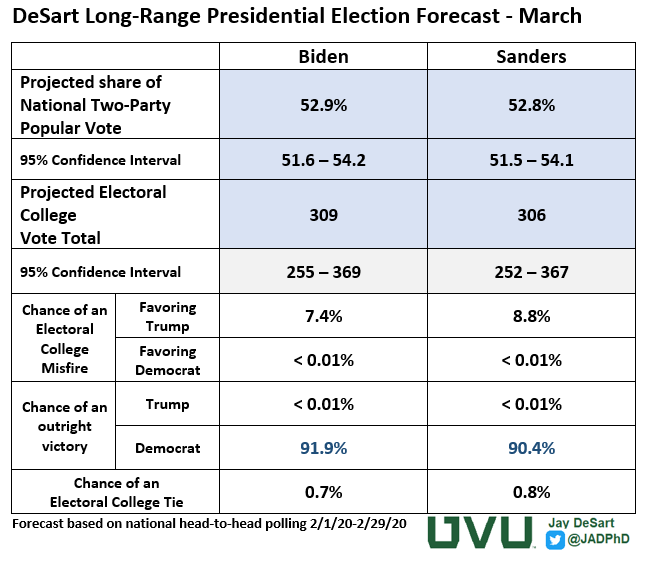
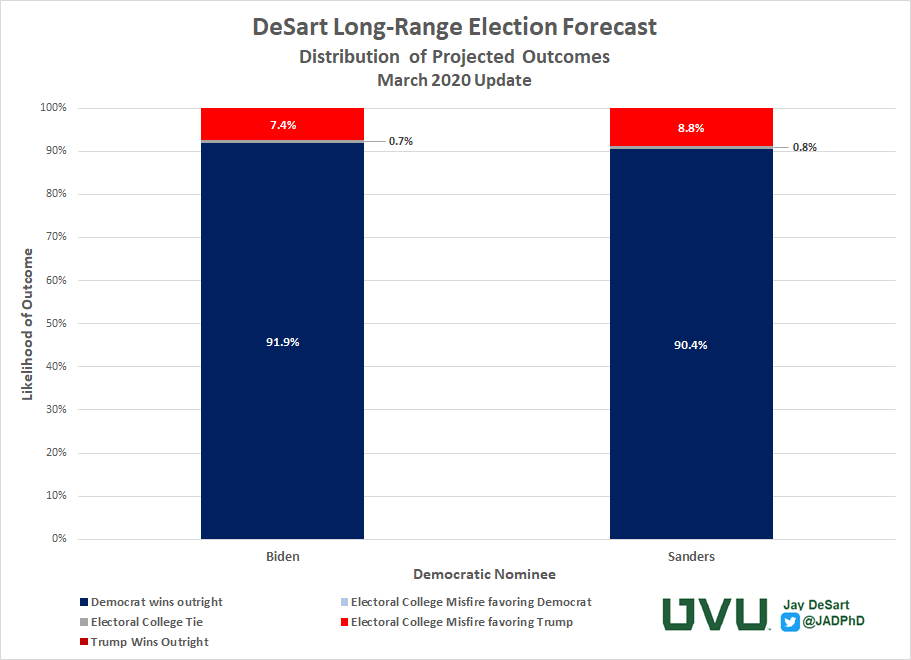
Primaries and caucuses are actually fairly predictable events once you have a frame of reference to go by. We're now almost halfway through the nomination season and so we've had ample opportunity to observe how the candidates have performed in a variety of states. If we know the characteristics of the states that were relevant in explaining the results, we can attempt to use those characteristics to help us project what will happen in the races yet to come.
For example, one very important characteristic that can explain how well Biden and Sanders performed in each of the two dozen states that have had their contests to date is their level of racial diversity, specifically the percentage of their population that is African-American. As the figure below shows, a state's percentage of black population has almost exactly the opposite relationship between how well Joe Biden performed in its contest and how well Bernie Sanders fared. As the figure below shows, Biden has done substantially better in the more racially diverse states, while Bernie Sanders did substantially worse.
If that pattern remains the same for the remaining contests, and there's no reason at this point to expect that it won't, that alone is bad news for Sanders.
To understand why this is a problem for Sanders, all you have to do is take a look at the chart above again and note the location of the intersection between the two lines. Once a state's black population reaches 10%, Sanders hasn't been able to win. His only victories have come when the state's black population has been eight percent or below.
Making matters worse for Sanders is that most of the remaining delegates left to claim are also in states where the percentage of the population is 10% or above. There are 26 states left that have not yet held their delegate selection contests. 27 if you include the District of Columbia. All told, those states and DC represent 1949 delegates left to claim.
Of those 1949 remaining delegates, over two-thirds (1347) of them are in states where African-Americans make up more than 10% of the state's overall population. Unless Sanders can break through and raise his appeal among that segment of the population, it will be all but impossible for him to overtake Biden's growing delegate lead.
One place where Sanders has done quite well up to this point has been in caucus states, just as he had done in 2016. Caucuses, as opposed to primaries, tend to have lower levels of participation and that typically benefits candidates who have very dedicated followers. So far in 2020 Sanders, on average, yielded 9% more of the vote in Caucus states than he did in primary states. But even here, he has a problem. Of the remaining states left to hold their contests, only one of them is a caucus state, Wyoming, and there just aren't many delegates at stake there.
He has also tended to do better in open primaries where participation is open to anyone regardless of their party registration. All other things being equal, when participation is limited to only those who are registered as Democrats as it is in a closed primary, Sanders averages 9% less of the vote compared to primaries where anyone is allowed to participate.
Here, once again, Sanders has a problem. Of the 26 remaining states yet to hold their delegate selection contests, only 5 are open primaries. The rest limit participation based on party registration, and he has fared less well in those.
Finally, he also did much better when there were more candidates in the running. He garnered more votes and delegates when he was up against a larger, more divided field. Now that the list of contenders has winnowed its way down to him and Biden (again, sorry Tulsi) it has meant he's had a tougher time growing his vote share as more and more Democratic voters have coalesced around the former Vice President.
What this all translates into is that the remaining contests present a rather daunting gauntlet for Sanders to clear through. Most of the contests that presented favorable conditions for him have already passed leaving him not much left to work with. Biden's growing lead is quickly becoming insurmountable. As the Figure below suggests, the South Carolina primary on February 29th, was a key turning point early in the race, and since then Biden has begun to amass a growing delegate lead over Sanders.
When putting together all of these important state characteristics into an explanation of the results of the contests so far, and then using that explanation to try and predict what will happening the remaining contests, it does not present a very rosy picture for Bernie Sanders. The figure above shows the projection of how the race will turn out without some substantial shift in the dynamics of the campaign.
This figure shows how Biden's and Sanders' delegate totals are expected to grow throughout the remainder of the nomination season. The most notable takeaway from this is that the gap between Biden and Sanders never closes. It just keeps growing. This clearly suggests that Biden has the momentum and unless something significant happens, Sanders will not be able to stop him.
These projections also suggest that Biden will win a majority of the pledged delegates much earlier than Hillary Clinton did in 2016. Four years ago, Clinton was not able to lock up a majority of pledged delegates until the California primary took place on June 7. This, by the way, was the exact date my projections four years ago predicted using this same forecasting method. When all was said and done, the model missed Clinton's (and, consequently Sanders') final delegate total by just 16 delegates.
This time around, this model suggests that Biden will reach the threshold of a majority of pledged delegates (1991) on May 2nd. After big projected wins in the delegate-rich states of New York and Pennsylvania on April 28, the model suggests that he will be just shy of the threshold. It predicts that he will win the Kansas Primary on May 2, and that will put him over the top to become the presumptive nominee well before the the Convention in July.
Even accounting for the model's uncertainty doesn't really help Sanders. When I ran 100,000 simulations of the remaining contests using this model's estimates and factoring in its level of uncertainty, in none of those instances did Sanders' delegate count get over 1388, still well short of the 1991 he would need. On the other hand, running the same routine for Biden yielded majority outcomes in every single simulation. Simply put, unless something changes, this model suggests that there is a less than 1 in 100,000 chance that Sanders will be able to overcome Biden's lead in the remaining contests, almost assuring that the former Vice President will secure the nomination.
Of course, the dose of humility that 2016 fed to most of us election forecasters does give me some pause. There are several contests, and weeks, to go. There's always the possibility that something unforeseen could occur and fundamentally alter the trajectory of these projections. But the window of opportunity for something like that to happen is quickly closing for Sanders. Without something big happening in the next couple of weeks, it doesn't seem like there's much of a chance for Sanders to recover.
But if it does, I'll be there looking at the numbers, because that's what a nerd does.


