Monday, October 5, 2020

The DeSart & Holbrook 2020 Presidential Election Forecast

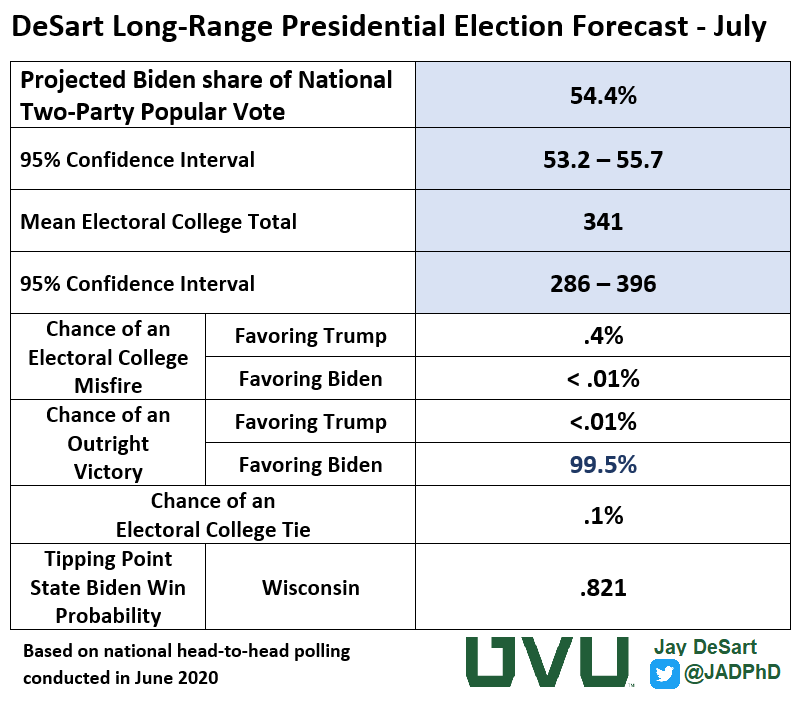
 For the past 5 presidential elections, Tom Holbrook and I have been generating forecasts of the national popular vote and Electoral College vote using a model that we developed in 1999.  Applying that same model to the data from 2020, we are projecting that Joe Biden will win a majority of the national two-party popular vote by a fairly wide margin of 54.4 to 45.6 over Donald Trump.   It also suggests that Biden will win 358 Electoral Votes to Trump's 180.

Our model uses state- and national-level polling in the month of September, along with each state's electoral history, to generate a prediction for each state's outcome.  In addition, we can use this data to calculate a probability for each candidate on how likely it is that they will win each state. We can then extrapolate those predictions up to the national-level to project the popular vote and Electoral College vote outcomes a month in advance of the election.  

Using this method, we have correctly predicted the winner of the national popular vote in each election from 2000 to 2016. Our track-record for our Electoral College projections is a little more mixed. We incorrectly projected that Al Gore and Hillary Clinton would win in 2000 and 2016, respectively. On the other hand, we went 51 for 51 in predicting the winner of all 50 states and the District of Columbia in 2012.

In 2016, our model projected that Hillary Clinton would win 52.05% of the national two-party popular vote, an error of just .95.  Our Electoral College projection estimated that Clinton would defeat Donald Trump 326 to 212.  We got five states wrong: Florida, Michigan, Ohio, Pennsylvania, and Wisconsin.  It's notable to point out that our model gave Hillary Clinton less than a 90% chance of winning of each of those states.  It's important to point that out because our model has never incorrectly predicted a state where it predicted a greater than 90% chance that it will be won by a candidate.

This is particularly relevant, because as you can see from the figure of Predicted Win Probabilities below, there are a number of states that the model predicts Joe Biden has a greater than 90% chance of winning.  More importantly, the number of Electoral Votes associated with these states totals 279, nine more than a candidate needs in order to win the election.  This suggests that even if Biden were to lose every other state, he would still win an Electoral College majority.


Of note is the location of the "tipping point" state.  This is the state where, when all states are arranged in order of their win probabilities, either candidate would achieve an Electoral College majority.  That state is Pennsylvania.  The problem for Trump is that it is located well within the Biden column. The model suggests that Biden has a 93.5% chance of winning Pennsylvania.  To win the election, Donald Trump is going to have to win seven states that the model suggests Joe Biden has a better than 50-50 chance of winning, two of which are over 90%.  That's not an impossible task, but it just doesn't seem likely.


Simulated Election Outcomes

As I mentioned above, we are able to take each of the model's predicted state-level outcomes and extrapolate national-level outcomes from them.  We can project the national popular vote by calculating a national popular vote total by taking each state's predicted outcome, weighting it by its contribution to the total national vote in the previous election, and summing it up.  That's how we derived the national popular vote projection of 54.4% for Biden.

We derive the Electoral College vote by simply awarding a state's Electoral Vote on the basis of the model's point estimates. One thing new this year, is that we are also incorporating projections for the Electoral Votes tied to the Maine and Nebraska Congressional Districts.  Doing this yields the Electoral College map pictured below.


You can see that the model suggests a split result in Nebraska.  While Trump is the clear favorite in the statewide vote, as well as in the First and Third Congressional District, the model indicates that Biden has a 74% chance of winning the Second Congressional District just as he and Barack Obama did in 2008.  On the other hand, the model suggests that Biden will win all four Electoral Votes in Maine, denying Trump the Electoral Vote associated with the the Second District that he won in 2016.

When we factor in the the uncertainty of the model, we can create confidence intervals around these projections. We run simulated elections while allowing each state to randomly vary around the standard error of the estimate, and aggregate the outcome in 100,000 simulated elections. Doing this yields the frequency distributions displayed below.


As you can see, Donald Trump does not win a majority of the national two party popular vote in any of the 100,000 simulations. 95% of Biden's outcomes fall within a range of 53.5 and 55.4%, so that serves as our Confidence Interval. When we expand the level of confidence out to 99%, the interval ranges from 53.1 to 55.8.

The distribution of Electoral College outcomes reveals the only ray of hope for Trump, but even so, the ray is very dim.  The most frequently occurring outcome is the one based on the point estimates of the model: Biden over Trump 358-180.  However, given the uneven relationship between the popular vote and the Electoral College Vote, the average outcome is 338-200. 95% of the outcomes fall within a range where Biden wins between 291 and 384 Electoral Votes.  99% fall between 279 and 401.


In other words, there is a greater than 99% chance based on this analysis, that Joe Biden will win and Electoral College majority and win the election. There is a small collection of outcomes where Donald Trump manages to win an Electoral College majority. In only 105 of the 100,000 simulations does Donald Trump win re-election, but it would entail a repeat of the 2016 election where he wins the Electoral College but fails to win the popular vote.


But what about 2016?

It's legitimate to question this prediction given that we, and a lot of other forecasters, missed the mark with our model in 2016. But there are some key substantive differences between 2016 and 2020 that leads us to have a bit more confidence in this forecast despite the 2016 misfire.

First, the lead that Joe Biden has in the national polls is substantively different than the lead that Hillary Clinton had in 2016.  Despite the widespread perception that "polls are broken" after what happened in 2016, national polls were not really as inaccurate as people think they were.  In September 2016, Hillary Clinton had an average two-party share of just 51.9% in national polls.  This is remarkably close to the actual result.  She ultimately won 51.1% of the two-party popular vote.

In contrast, Joe Biden's average share of the national polls in September was 53.8%, considerably higher than that of Clinton in 2016.  The polls have been remarkably stable over the past 12 months.  Biden has consistently led Trump since October of last year.  Over that time, Biden's monthly average two-party share in the polls has never dropped below 52.3% Given that, it seems highly unlikely that this lead will simply evaporate in the campaign's final weeks.

Of course, as we learned in 2016, it's what happens in the states that really matters when it comes to the deciding the Electoral College outcomes. It was the state-level polling that had the biggest issues in 2016, missing the mark in key states that ultimately tipped the balance in favor of Donald Trump.

Here, again, the situation is different than it was in 2016. The figure below shows the comparison of average September poll results for each of the 50 states.  In general, there has been an average shift towards Biden of a little over 2% across the states.  


Over the past five elections, without exception, when a candidate has a statistically significant lead in a poll in a state (ie, the lead is beyond the margin of error) for the month of September, they end up winning that state.

The table below dives a little further into this  comparison of the polling in 2016 with that of 2020. It shows how the September state polls compared to the eventual outcome.  Generally speaking, you can see evidence of what I mentioned above: September polls in 2016 actually did a reasonably good job of telling us what was going to happen in November, even at the state-level.  To be sure, there were polls in key states that ended up over-estimating Clinton's support, but her lead in those states was not statistically significant.  


Simply put, we could not be confident that she was actually leading in those states given the margin of error, so it should not have really been a surprise that she did not win those states. Most important is the fact that the disposition of many of these states this year is different than they were in 2016.  I have marked those states with an arrow showing how they've shifted.

All 12 states that have shifted since 2016 have moved away from Trump and towards Biden.  Trump does not have statistically significant leads in two states that were statistical locks for him in 2016: Alaska and Texas.  That doesn't mean he will lose those states, but it suggests that his position there, at least according to the polls, isn't as firm as it was four years ago.

Four states where Trump held statistically insignificant leads in 2016 have shifted towards Biden as well: Arizona, Georgia, Nevada, and Ohio. Biden holds slight leads in all four. Again, we can't say with any confidence that Biden will necessarily win those states simply based on these polls, but it is indicative of the general shift away from Trump compared to 2016.

Most relevant are the six states that have moved from being states that Clinton held insignificant leads in 2016 to states where, in 2020, Biden has a lead that is beyond the margin of error: Colorado, Maine, Michigan, Minnesota, New Hampshire, and Virginia. As I've stated above, in every election we've looked at going back to 2000, a candidate goes on to win a state where they hold a statistically significant lead in September. 

The states where Biden holds statistically significant leads account for a total of 240 Electoral Votes, meaning he only needs to find 30 more in order to win a majority.  A combination of just two or three of the eight states where he holds slight leads is all he needs to get him across the finish line. At this point it seems improbable, but not impossible, that Trump could win re-election. The map, and the context, looks considerably more difficult for him than it was in 2016. 

If 2016 taught us anything, however, it's that you shouldn't take anything for granted.  When the results come in next month, I'll be there looking at the numbers, because that's what a nerd does.

Monday, July 13, 2020

Long-Range Election Forecast - July 2020

For the first time this election cycle, my Long-Range Election Forecast model projects an Electoral College margin of victory for Joe Biden that is beyond the 95% confidence interval.  It suggests that Biden will win anywhere between 286 and 396 Electoral Votes.  The most likely outcome has him winning around 334 Electoral Votes.

The model looks at the previous election outcome in each of the 50 states and projects an outcome for them based on three additional factors:

  • Monthly national head-to-head polling between the two major party candidates
  • Home State Advantage
  • Regime age (i.e. how long the incumbent party has held the White House)
I can then extrapolate the projected state-level results up to the national-level for both the popular vote (by taking a turnout-weighted sum of each state's contribution to the national-level total) and the Electoral College total (by awarding each state's Electoral College votes to the candidate that the model projects will win it).

It is also possible to calculate a win-probability for each state based on the model's projected outcomes.  Not all states are equal.  Some states are just more likely to be won by one party's candidate over another.  Simply put, it's highly likely that a Democrat will win states like California, Massachusetts, and Illinois, and that a Republican will win states like Wyoming, North Dakota, and Alabama.  Other states are more likely to be considered battleground states like Florida, Arizona and Ohio.

Using these win-probabilities, I can run simulated elections to see who will win and who will lose, while taking into account a certain amount of uncertainty in the state-level outcomes.  I had the computer do that 100,000 times.  I present the results of that analysis in the table below. In those 100,000 simulated elections, Joe Biden won the national popular vote in every single one of them, and the Electoral College in 99,503 times.  Donald Trump's 400+ victories all came as a result of an Electoral College misfire, just as it did in 2016.

Beyond the election simulations, the key statistic for me is what can be called the "tipping point state."  This is the state that, when you arrange them all based on their likelihood that they'll be won by one candidate over the other, will be the one that puts either one over the top and give them the 270 votes needed in the Electoral College in order to win a majority.

The model suggests, as can be seen in the figure below, that Wisconsin is that state. Right now, the model suggests that Joe Biden has an 82.1% chance of winning Wisconsin.  From a strictly statistical perspective, that's not high enough to be "certain." Us statistics nerds like to see a likelihood above 90-95% for us to have confidence.  But it certainly is suggesting that it is more likely than not to happen.

For comparison sake, at this point in 2016 this model was projecting a very close election, but gave Trump a 65.9% chance of winning the Electoral College, which of course he did.  This was in spite of the fact that Hillary Clinton held substantial leads in the national head-to-head polling in June of 2016. 

The context of 2020 is substantively different than that of 2016.  You don't have a party attempting to hold on to the White House for a third consecutive term, which is notoriously difficult to do.  Instead, we've got an embattled President running for re-election after winning a close election four years earlier, and doing so with a discrepant outcome between the national popular vote and Electoral College.

Of course something could happen between now and November that could alter the trajectory of the race.  We saw that in 2016. Until that happens, however, this model suggests that it doesn't seem likely that Donald Trump will be successful in winning a second term.

But if and when that happens, I'll be there looking at the numbers, because that's what a nerd does.

Sunday, March 15, 2020

The Long Difficult Road Ahead for Sanders

If 2016 taught us anything it would be to never say "Never." There's always a chance that expectations could miss the mark, and the unexpected event could happen.  But sometimes things seem so unlikely that it's difficult to not want to use that word.  That's sort of the situation Bernie Sanders finds himself in right now.  Based on my analysis of the outcomes of the primaries and caucuses so far, it really doesn't seem likely that he is going to become the Democratic nominee.

Primaries and caucuses are actually fairly predictable events once you have a frame of reference to go by. We're now almost halfway through the nomination season and so we've had ample opportunity to observe how the candidates have performed in a variety of states.  If we know the characteristics of the states that were relevant in explaining the results, we can attempt to use those characteristics to help us project what will happen in the races yet to come.

For example, one very important characteristic that can explain how well Biden and Sanders performed in each of the two dozen states that have had their contests to date is their level of racial diversity, specifically the percentage of their population that is African-American.  As the figure below shows, a state's percentage of black population has almost exactly the opposite relationship between how well Joe Biden performed in its contest and how well Bernie Sanders fared.  As the figure below shows, Biden has done substantially better in the more racially diverse states, while Bernie Sanders did substantially worse.


If that pattern remains the same for the remaining contests, and there's no reason at this point to expect that it won't, that alone is bad news for Sanders. 

To understand why this is a problem for Sanders, all you have to do is take a look at the chart above again and note the location of the intersection between the two lines. Once a state's black population reaches 10%, Sanders hasn't been able to win.  His only victories have come when the state's black population has been eight percent or below.

Making matters worse for Sanders is that most of the remaining delegates left to claim are also in states where the percentage of the population is 10% or above.  There are 26 states left that have not yet held their delegate selection contests. 27 if you include the District of Columbia.  All told, those states and DC represent 1949 delegates left to claim.

Of those 1949 remaining delegates, over two-thirds (1347) of them are in states where African-Americans make up more than 10% of the state's overall population.  Unless Sanders can break through and raise his appeal among that segment of the population, it will be all but impossible for him to overtake Biden's growing delegate lead.

One place where Sanders has done quite well up to this point has been in caucus states, just as he had done in 2016.  Caucuses, as opposed to primaries, tend to have lower levels of participation and that typically benefits candidates who have very dedicated followers.  So far in 2020 Sanders, on average, yielded 9% more of the vote in Caucus states than he did in primary states. But even here, he has a problem.  Of the remaining states left to hold their contests, only one of them is a caucus state, Wyoming, and there just aren't many delegates at stake there.

He has also tended to do better in open primaries where participation is open to anyone regardless of their party registration.  All other things being equal, when participation is limited to only those who are registered as Democrats as it is in a closed primary, Sanders averages 9% less of the vote compared to primaries where anyone is allowed to participate.

Here, once again, Sanders has a problem.  Of the 26 remaining states yet to hold their delegate selection contests, only 5 are open primaries. The rest limit participation based on party registration, and he has fared less well in those.

Finally, he also did much better when there were more candidates in the running.  He garnered more votes and delegates when he was up against a larger, more divided field.  Now that the list of contenders has winnowed its way down to him and Biden (again, sorry Tulsi) it has meant he's had a tougher time growing his vote share as more and more Democratic voters have coalesced around the former Vice President.

What this all translates into is that the remaining contests present a rather daunting gauntlet for Sanders to clear through. Most of the contests that presented favorable conditions for him have already passed leaving him not much left to work with. Biden's growing lead is quickly becoming insurmountable.  As the Figure below suggests, the South Carolina primary on February 29th, was a key turning point early in the race, and since then Biden has begun to amass a growing delegate lead over Sanders.


When putting together all of these important state characteristics into an explanation of the results of the contests so far, and then using that explanation to try and predict what will happening the remaining contests, it does not present a very rosy picture for Bernie Sanders.  The figure above shows the projection of how the race will turn out without some substantial shift in the dynamics of the campaign.

This figure shows how Biden's and Sanders' delegate totals are expected to grow throughout the remainder of the nomination season.  The most notable takeaway from this is that the gap between Biden and Sanders never closes. It just keeps growing.  This clearly suggests that Biden has the momentum and unless something significant happens, Sanders will not be able to stop him.

These projections also suggest that Biden will win a majority of the pledged delegates much earlier than Hillary Clinton did in 2016.  Four years ago, Clinton was not able to lock up a majority of pledged delegates until the California primary took place on June 7.  This, by the way, was the exact date my projections four years ago predicted using this same forecasting method.  When all was said and done, the model missed Clinton's (and, consequently Sanders') final delegate total by just 16 delegates.

This time around, this model suggests that Biden will reach the threshold of a majority of pledged delegates (1991) on May 2nd. After big projected wins in the delegate-rich states of New York and Pennsylvania on April 28, the model suggests that he will be just shy of the threshold. It predicts that he will win the Kansas Primary on May 2, and that will put him over the top to become the presumptive nominee well before the the Convention in July.

Even accounting for the model's uncertainty doesn't really help Sanders.  When I ran 100,000 simulations of the remaining contests using this model's estimates and factoring in its level of uncertainty, in none of those instances did Sanders' delegate count get over 1388, still well short of the 1991 he would need.  On the other hand, running the same routine for Biden yielded majority outcomes in every single simulation.  Simply put, unless something changes, this model suggests that there is a less than 1 in 100,000 chance that Sanders will be able to overcome Biden's lead in the remaining contests, almost assuring that the former Vice President will secure the nomination.

Of course, the dose of humility that 2016 fed to most of us election forecasters does give me some pause.  There are several contests, and weeks, to go.  There's always the possibility that something unforeseen could occur and fundamentally alter the trajectory of these projections. But the window of opportunity for something like that to happen is quickly closing for Sanders.  Without something big happening in the next couple of weeks, it doesn't seem like there's much of a chance for Sanders to recover.

But if it does, I'll be there looking at the numbers, because that's what a nerd does. 

Thursday, March 12, 2020

Long-Range 2020 Election Forecast - March Update


A little over five months ago, I posted a forecast of what would happen in the 2020 presidential election based on a long-range election forecast model that I developed back in 2015.  That forecast suggested a strong possibility of Democratic victory in 2020, but it really depended upon who won the nomination.

That forecast indicated that Biden, Sanders, and Warren all stood the best chance of defeating Trump in November, but that Biden was best positioned.  It was much less bullish on Harris and Buttigieg.  Klobuchar and Bloomberg weren't even on the radar yet.

A lot has happened since November 2019, as often happens during the nomination phase of a Presidential Election cycle. The Democratic field has winnowed down to essentially two candidates, Joe Biden and Bernie Sanders. (Sorry, Tulsi) So, there's really two questions to ask at this point:
  1. Has anything changed since November?
  2. Does it matter which candidate the Democrats nominate?
The answer to the first question is simple: Not much.  The only thing that has really changed is that it's a lot easier for me to generate the forecasts because now there's only two candidates for which I need to generate forecasts.  Beyond that, the forecast hasn't shifted much since November.  So the answer to the second question also seems to be "Not much."

Both Biden and Sanders are projected to win the popular vote with ease under this update. The only real shift is that the model is slightly more bullish on their chances at winning the Electoral College as well.


While the projected Electoral College vote totals are slightly higher for both Biden and Sanders than they were 5 months ago, the 95% confidence intervals still leave open the possibility for Trump to win reelection.  Simply put, there's more than an insignificant chance that Donald Trump could win a second term. The interesting thing about that is that the model suggests that pretty much the only path to victory for Trump is through a repeat of 2016: an Electoral College misfire where the Democrat wins the popular vote but Trump wins at least 270 Electoral Votes and claims victory.

Using the model's point estimates for each of the state-level outcomes, and factoring in its level of prediction error, I ran a simulation of 100,000 elections for each potential pairing to get a range of possible outcomes.  The breakdown of those 100,000 simulated elections is shown in the bottom half of the table above.  In addition, the chart below presents how often each possible outcome appeared.


Out of the 100,000 simulated elections between Joe Biden and Donald Trump, Biden won both the popular vote and Electoral College vote 91.9% of the time.  In none of those elections did the same happen for Trump.  Every single one of the simulated elections where Trump defeated Biden in the Electoral College, it came when he lost the popular vote. 

The outcomes were similar in the matchup between Bernie Sanders and Donald Trump, although there was a slightly lower occurrence of an outright Sanders victory (90.4%), and a slightly higher occurrence of an Electoral College misfire benefiting Trump. (8.4%).  Regardless of which candidate the Democrats nominate, this model suggests that there is a very slight, (less than 1%) of an Electoral College 269-269 tie, necessitating a vote by the U.S. House of Representatives to determine the winner.

For comparison purposes, when I used this model in March of 2016 and generated a similar distribution of possible outcomes, the model projected an Electoral College victory for Donald Trump 66.3% of the time.  Simply put, the model saw a Trump victory in 2016 as much more likely than a repeat performance in 2020.

We'll just have to wait another eight months to see how well this projection holds up. A lot can happen between now and then, and that could alter the context and trajectory of this race. I will be posting periodic updates to the forecast in that time.

So, stay tuned. In the meantime, I'll keep looking at the numbers, because that's what a nerd does.

Tuesday, November 5, 2019

Who Will Win in 2020? It Depends - The Long-Range State-Level Forecast

A little over four years ago in October of 2015, I got up in front of a bunch of political scientists at a small conference in Iowa, the Iowa Conference on Presidential Politics, and suggested that there was a very strong possibility that Donald Trump could win the 2016 Presidential election.  I showed the results of a new long-range presidential election forecast model that I had developed to generate a prediction a year in advance of the election.

It should perhaps come as no surprise that the prediction was met with a great deal of incredulity.

"Really? Donald Trump?! No way!"

I admit I was a bit skeptical myself.  The brash, unpolished reality TV host with no experience? It did seem a bit incredible. But, it's what the numbers showed, and for as long as I've been doing election forecasting I've always just gone with what the numbers showed.  Right or wrong, the numbers are what they are and all I do is report what they say.

But still, it just didn't seem likely at that point. Of course, looking back now we can clearly see that the skepticism was misplaced.

So, what does this model say about the next election? We are now one year away from the 2020 election, so who does it say will win?

The answer is: It depends.

It depends, in large part, on who the Democrats nominate to run against Donald Trump.  But even then, the answer is far from certain. The main challenge of attempting to forecast an election outcome this far in advance of the election is that we don't even really know who the nominees will be at this point. This necessitates a model that can generate a set of conditional forecasts that present different possible match-ups of candidates and can show how the parties' choice of a nominee can effect the outcome.

At this point, the Democrat that the model suggests has the clearest path to victory over Donald Trump next year is Joe Biden, but that victory is not necessarily certain.  The model also suggests that Bernie Sanders and Elizabeth Warren also have decent chances of defeating the president, but their victories are even less certain. For the remaining two candidates in the apparent "Top Five" of the Democratic field, Kamala Harris and Pete Buttigieg, the forecast is even murkier, with the model suggesting that it is more likely than not that they could meet the same fate as Hillary Clinton did in 2016 winning the popular vote, but failing to win in the Electoral College.

The forecasts are given in the table below:


You can see, all of the top five Democratic candidates are projected by the model to win the national popular vote, but only Biden, Sanders, and Warren have projected wins that are beyond the 95% confidence interval. The possibility that Buttigieg and Harris would lose the popular vote to Trump cannot be discounted. On the other hand, if we were to broaden the confidence interval to 99% confidence, Biden, Sanders and Warren all still have projections that are above the magic 50% threshold.  Simply put, if one of those three end up winning the nomination, the model suggests it is highly likely any one of these three would win the national popular vote against Donald Trump.

Of course, we learned in 2016 that the national popular vote isn't what matters most in U.S. Presidential elections.  Instead, it's the Electoral College vote that ultimately determines the winner. It's about putting together the right combination of states in order to get the required 270 Electoral College votes to win.  As you can see, the model projects that the three candidates it suggests will win the popular vote will also win the Electoral College vote as well.  For Buttigieg and Harris, the model suggests that a repeat of 2016, where one candidate wins the popular vote but loses the Electoral College, is likely should either one of them become the nominee.  In fact, if you look in the bottom two rows of the table above, you can see that the model suggests that an Electoral College misfire favoring Trump is more likely than not for both of them.

However, even though Biden, Sanders and Warren have Electoral College projections that are above the required 270, the model is far less certain about their victory than it is of their popular vote wins.  For all three, there is a distinct possibility of an Electoral College misfire, just to varying degrees.  Biden fares the best in this situation.  The model projects a clear Electoral College majority for him, while leaving a 11.8% chance that he could fall victim to the same fate Hillary Clinton met in 2016.

Sanders and Warren fare less well in that regard.  Again, while the model projects that both would win an Electoral College majority in 2020, the possibility that they would fail to do so cannot be discounted.  For Sanders, the likelihood that he would win the popular vote, but lose in the Electoral College is a little greater than one in four (27%). For Warren, it's a little greater than one in three (34.1%)

So, you might be asking, where do these numbers come from and, more importantly, can we trust them? Both very fair questions, and I'll try to answer them as best and as simply as I can.

Let's get nerdy.

The Model

These forecasts come from a very simple model, which I have presented at a few different conferences over the past four years, most recently at the American Political Science Association conference in Washington, DC this past Summer.  I talked a little bit about this model in an earlier post, but you can actually download the paper and read it yourself here.

It generates predicted outcomes for each of the 50 states and the District of Columbia based on four variables: the state's result in the previous election, the match-up between the various candidates 13 months in advance of the election, a specification of home state advantage based on where the candidates come from, and a regime age variable that captures the notion that it is more difficult for a party to hold on to the White House the longer it is there.  It is this last variable that was key in generating a prediction favorable to Donald Trump in 2015.

There is a very strong correlation from one election to the next in how the parties fare in each of the fifty states, as shown by the figure below:

There is one weird outlying case there on the left side of the chart.  That's Utah. Trump fared much less well in Utah compared to Romney's performance there in 2012.  When you think about that, it's pretty easy to understand why. As a member of the Church of Jesus Christ of Latter Day Saints, Romney's identification as a Mormon was a key topic of discussion during the campaign of 2012.  And Utah just happens to have the highest concentration of LDS population in the country.  Fast-forward to 2016, and there is widespread disenchantment in Utah about Trump as the Republican nominee.  So much so that a local, Evan McMullin, declares his candidacy and manages to win 21% of the vote and significantly eats into the vote margin that a Republican candidate would likely win in Utah.  If you take that one outlier out of the analysis, and the relationship between 2012 and 2016 state-level outcomes becomes even stronger.

This strong correlation is present going back for the past seven elections and serves as a solid foundation for the rest of the model.  The remaining variables are intended to capture elements about the current election that make it different from the previous one: who the candidates are and how they match up against each other, what states those candidates are from which would affect a home-state advantage in one state more than others, and how long a party has occupied the White House.

Using those four variables, I can generate a prediction of the result for each of the 50 states and the District of Columbia.  From there I can extrapolate the national-level outcomes.  For the national popular vote, I calculate the weighted sum of the predicted state outcomes based on each of their contribution to the overall total.  For the Electoral College, it is based on whether the model predicts a candidate will win the state or not.

I incorporate the uncertainty into the model by constructing confidence intervals around the state-level predictions based on the model's standard error of the estimate. Simply put, this is roughly a measure of how much the model "mispredicts" the actual state-level outcomes, on average. Currently, based on the past seven elections' worth of data, that average misprediction is about 3.2%.

Factoring that uncertainty into the prediction, I have the computer run a series of hypothetical elections. 100,000 of them to be precise, and I plot the outcomes.  That's where the confidence intervals come from.  So, to put the numbers in the table above into perspective, it's essentially saying that of the 100,000 hypothetical elections I had the computer run between Joe Biden and Donald Trump, 11.8% of them had outcomes where Joe Biden won the popular vote, but lost the in the Electoral College.

It's not shown in the table, but in three of those 100,000 hypothetical elections (.003%) the President defeats Biden in both the popular vote AND Electoral College.  So, it's not impossible that Trump could defeat Biden outright, but the model suggests that it's highly unlikely.

Granted, we've got 12 long months to go until we get there and many things could happen between now and then. Ultimately, the main takeaway from this forecast is that the outcome is far from certain. So we'll have to do the only thing we can do... wait and see how this plays out. 

And when it does, I'll be there, looking at the numbers, because that's what us nerds do.

Saturday, December 16, 2017

In Spite of Alabama, The Democrats Probably Still Won't Win Control of the Senate in 2018

The results of last week's special Senate election in Alabama, along with the strong showing for Democrats in elections nationwide here in the past couple of months, have got Democrats feeling pretty optimistic for their prospects in next year's midterm elections.

In my last post, I showed that there's a strong likelihood that the Democrats will regain control of the House. I showed that a couple key contextual factors (i.e. presidential approval and unified party control) appear to be critical in shaping the outcome of U.S. House elections, and that those contextual factors would seem to suggest that the Democrats have a fairly decent chance of winning enough seats to become the majority party in the House. Obviously, those same contextual factors will be present for next year's Senate races, but given a key difference in the nature of Senate elections, the Democrats' prospects of gaining control of the Senate are much slimmer.

There is most definitely a correlation between the number of House and Senate seats lost by the president's party at midterm.  When it's a good year for a party, it usually translates into being a good year for their electoral fates in both chambers, as the figure below shows.


This would seem to suggest that the same forces that affect House races are in play for Senate races as well.  Indeed, just as there is a strong correlation between presidential approval and House seat losses for his party at midterm, there is a similar pattern in midterm loss in the Senate as well. Presidents with lower approval ratings tend to see their party lose more Senate seats at midterm.


There is, however, a substantial amount of variation in outcomes that presidential approval alone doesn't explain.  For example, presidents with approval ratings within the very narrow range of 43 to 46% have experienced Senate midterm losses anywhere between 0 and 8 seats.  That doesn't really make for a prediction in which one can have much confidence. Clearly there are other factors beyond presidential approval that explain variation in aggregate Senate outcomes.

In my previous post, I showed that whether or not a president faced unified or divided party control helped explain midterm losses for his party in House of Representatives races. The president's party tends to lose, on average, 10 more seats at midterm under unified party control than it does under divided party control.  In Senate elections, that effect does not appear. Clearly, something else is at work here.


One key difference between House and Senate races that likely explains this is the fact that, unlike House elections, only a third of the Senate comes up for election at a time. That means that the aggregate outcome in Senate elections may largely be a function of which particular seats are up for election in any given year. 

What I'm talking about here is the notion of exposure; A party can be more or less exposed to seat loss depending upon how many seats it's actually defending. Simply put: It's easier for a party to lose seats when it has more seats up for election.  This idea is certainly not a new one to Political Science. It's been around for decades.

As the figure below shows, there's a pretty substantial correlation between the number of seats a party is defending in a midterm election and the number of seats they end up losing.  The more they are exposed, the more they lose. So, it's not as straightforward to argue that midterm Senate losses are simply a function of presidential approval.


That being said, however, it is interesting to note that the three midterm elections in which the President's party lost significantly fewer seats than one would expect simply based on its level of exposure are those in which presidential approval was the highest (1962, 1998, and 2002). Clearly Senate midterms are a different creature than House midterms, but with one point of similarity: Presidential approval matters.

So, what does this mean for 2018?

In terms of presidential approval, as it stands right now, it would appear to be good news for the Democrats, just as it is over on the House side. Presidents who have an approval rating below 50 percent at midterm lose, on average 5.8 seats. Those with approval ratings of 40 percent or lower, where Trump is now, the average losses have been over seven seats.

On the other hand, that level of loss for the Republicans seems pretty unlikely given their level of exposure, or lack thereof as the case may be.  Of the 34 Senate seats that will be up for election next year, the Republicans are only going to be defending eight. That is the lowest level of exposure at midterm that we've seen since Truman, tied only with 1970, when Nixon and the Republicans gained three seats in the Senate.

The key difference between 1970 and 2018, however, is that Nixon enjoyed a 57% approval rating in 1970, which presumably helped the Republicans pick up seats from an already favorable context. At this point, however, it doesn't appear that Donald Trump will enjoy approval ratings quite that high next November.

[Warning: Nerdy statistics zone ahead]

To piece together these two competing forces I ran a very simple regression model pitting exposure and approval against each other in explaining midterm Senate losses.  These two variables together explain over 62% of the variation we see in the distribution of midterm losses for the president's party in Senate elections since 1946.  The model is as follows:

LOSSES = 5.647 + 0.603×EXPOSURE - 0.249×APPROVAL

Where: 
LOSSES is the predicted number of seats lost by the president's party in the Senate at midterm;
EXPOSURE is the number of Senate seats the president's party is defending at midterm; and
APPROVAL is the president's approval rating on midterm election day.

[End nerdy statistics zone]

If we plug in 8 for the level of exposure (this assumes no Republican Senators from seats not up for election in 2018 die or retire), and 37 for approval (President Trump's current average approval rating at both HuffPost Pollster and RealClearPolitics) we get a predicted seat loss of just one seat. With the Republicans currently sitting on a very slim 51-49 majority, that would result in a 50-50 split. But with the Constitution giving Vice President Pence the authority to cast tie-breaking votes in the Senate, for all intents and purposes, that still gives the Republicans a majority.

What makes the battle for control of the Senate particularly challenging for the Democrats in 2018 is that of the 26 seats they are defending next year, 10 of them are in states Trump won last year (Florida, Indiana, Michigan, Missouri, Montana, North Dakota, Ohio, Pennsylvania, West Virginia, and Wisconsin).  Of those 10, Trump won five of them quite comfortably by margins over 18% (Indiana, Missouri, Montana, North Dakota, and West Virginia).  

So, in order to gain control of the Senate, the Democrats would not only have to pick up two of the only eight seats the Republicans are defending, but they'll also have to hold on to a number of seats in states that went pretty heavily for Donald Trump in 2016.  Granted, it's easier for them to win two than it was for them to win the three they would have needed prior to Doug Jones' win in the Alabama special election on Tuesday. Even so, two is a pretty significant challenge under the circumstances.

Given all this, it seems pretty likely that the Republicans will retain control in the Senate in spite of what otherwise looks like will be a very strong year for the Democrats. 

Thursday, June 22, 2017

Presidential Approval, Unified Party Control, and Midterm Loss (oh my)

With this latest round of special elections behind us, a lot of people are speculating about what is going to happen in the 2018 midterm elections. There is very little evidence to suggest that what happens in special elections is indicative of what happens in the following full election. There is, however, quite a bit of empirical evidence beyond the special election results that gives us some idea of what will happen, and it suggests that 2018 will not be kind to the GOP majority in the U.S. House.

The first indication that 2018 will be a good year for Democrats is the well-documented phenomenon of midterm loss. Since 1946, the president's party loses an average of 25.6 seats in the House of Representatives in midterm elections. To regain control of the House, the Democrats need to pick up 24.


That doesn't leave a lot of room for error, and you'll see that there's quite a bit of variability in the magnitude of midterm losses over time. There are a number of years where the president's party lost significantly fewer than that average number. Indeed, in two years (1998 and 2002) the president's party actually gained seats. So there's certainly no guarantee from this that the Democrats would be able to win enough seats to regain majority control in the House.

The real question is whether there is some predictability to this variation that might give us some indication as to whether 2018 will be at the high end or low end of this distribution.  As it turns out, this variability is not random and it is possible to identify some of the factors that can foretell what kind of context a given midterm election year will bring.

One of these factors is whether the president faces unified or divided party control. Nearly 30 years ago, political scientist Gary Jacobson, one of the world's leading scholars on congressional elections, forwarded the argument that it is much easier for the party opposing the president to make gains in midterm elections when they are in the minority.  The argument is very simple: It's easier to point the finger of blame when someone else is clearly in charge. There is a lot of voter discontent and dissatisfaction with the way things are going in Washington. This is likely even more the case now than it was when Jacobson published his work. Given that, it is easier for the "out-party" to focus that discontent on the party in power when they hold all the keys, just as the Republicans do now. Whether or not it is fair to blame all the problems of government and society on the party in power is beside the point. What matters is that it appears to be an effective argument to make.

Indeed, there is strong empirical evidence to substantiate this claim. When presidents enjoy unified party control of Congress, on average they lose over twice as many seats in midterm elections than presidents facing divided party control (34.9 to 16.3).


The top three midterm losses for presidents since 1946 came in years when one party controlled both the White House and both houses of Congress (1946, 1994, and 2010). Again, while that is not good news for the Republican Party in 2018, there remains a good deal of variability in outcomes.  In 1962, a midterm election year in which Kennedy enjoyed unified control, the Democrats only lost 4 seats, and in 1978 Carter and the Democrats similarly only lost 15 seats. Both of those numbers are well shy of the gains Democrats would have to make in 2018 in order to regain control of the House.

Clearly, unified party control is not the only factor in explaining the magnitude of the losses for the president's party in midterm elections. There is another even more important factor that can explain what happens at midterm: presidential approval.

The correlation between presidential approval and congressional election outcomes has been fairly well documented over the years. The effect is fairly straightforward as well: Midterm elections are, in part, referendums on the sitting president. So the more popular the president is, the smaller his midterm losses will be. Indeed, the two years in which the president's party actually GAINED seats, 1998 and 2002, Presidents Clinton and Bush both had approval ratings at or above 65%.  In 1962, when the Democrats lost only 4 seats, Kennedy had 68% approval.


Even in the special elections we've seen so far in 2017, that pattern seems to hold up.  While it is true that Republicans have won every one of them, it has been pretty well documented that the Democratic candidates have outperformed their vote shares in those districts compared to previous elections.  When one considers that President Trump has approval that is hovering in the high 30s, it isn't a large leap in logic to suggest that these results seem to confirm the approval + midterm loss link. In a broader range of races where more competitive districts are part of the picture the impact would likely become more apparent in the aggregate.

So, that leaves us with two questions: 1) How do presidential approval and unified party control combine in explaining the variation in midterm loss, and 2) What will President Trump's approval rating be on Election Day 2018?

Answering the first question is fairly straightforward: Approval matters quite a bit, and its impact is compounded by unified party control. When a president has approval below 50 percent his party loses, on average, 29 seats in a context of divided party control. But in years where there is unified party control, his party typically loses around 46 seats.


On the other hand, when the President's approval rating is above 50%, the losses for his party are comparatively small, even in years when they have unified party control. Those losses tend to be much smaller than what the Democrats will need in order to win a majority in 2018. So, that brings us to the second question: What will President Trump's approval be on November 6, 2018?

Historically, presidents experience an average decline in their approval rating of about 10% between their inauguration and midterm election day. The change from inauguration to midterm ranges from big declines of 31 for Truman and 22 for LBJ and Obama to increases of 7 and 8 points for both first and second Bushes, respectively.


Again, that's a pretty big range and it is pretty difficult to project forward because there are so many factors that can potentially influence a president's standing with the public. Approval often tracks along with economic conditions, as the economy improves the presidents approval rating does as well. We don't typically see big swings in the short term as a result of the economy however.  Instead, the big swings are typically the result of some significant crisis.

Both Bushes enjoyed record levels of approval, largely as a result of a significant rally-event. The Iraqi invasion of Kuwait boosted George H.W. Bush's approval in advance of the 1990 midterm. Bush later saw his approval rating jump another 31 points in the months following the election when the U.S. invaded Iraq at the beginning of the Gulf War. George W. Bush saw an immediate 39% jump in his approval rating as a result of the September 11th attacks, the effects of which had begun to fade but were still being felt a year later at the time of the 2002 midterm elections.

Since it is impossible to tell if a major international event will occur between now and November 6, 2018, it is difficult to say with any certainty what President Trump's approval rating will be at that point.  Barring an event like that, it is reasonable to expect that his approval will follow the same trend line as every other president. Indeed, we've already seen his approval matching the downward trend that other presidents have experienced.  Gallup's first approval figure for President Trump following his inauguration was the lowest of any president since Truman at 45%. At this point five months into his presidency, his approval rating is hovering around 38%, about 7 points lower.  Where it goes from this point is anyone's guess.

But if we assume that his approval rebounds to at least his starting level, 45%, what does that mean for the expected losses for the Republicans in 2018?  If we look at the combined effects of approval and unified party control, the news is not good for the GOP.


The data suggest that the lower a president's approval rating is the worse his party will perform at midterm, and that his party will perform even worse when they face a situation of unified party control. 50% really appears to be the critical point.  No president with less than a 50% approval rating has experienced party losses in the midterm election fewer than 28 seats.

For a president with an approval rating of 45% and unified party control at midterm, the pattern in the data suggests that the typical loss would be about 37 seats, more than enough for the Democrats to regain majority control of the House.

Again, nobody really knows what President Trump's approval rating will be next November, and even if we did, there's still a good deal of variation in the size of the midterm loss that isn't explained by this data.  It's entirely possible that Trump's approval could rise significantly in the next 16 months, and even if it didn't it's also possible that the GOP could outperform the typical pattern.

But that requires a lot of things to happen that just don't seem terribly likely.

One thing seems fairly certain: whatever happens I'll be there looking at the numbers, because that's what a nerd does.