Monday, November 21, 2016

The Anti-Intellectual Election: I have seen the enemy and it is us.

In 1963 historian Richard Hofstadter published his influential and Pulitzer Prize-winning book entitled Anti-Intellectualism in American Life. In it he documented the historical and cultural roots of what he described as a resentment and suspicion of the life of the mind and of those who are considered to represent it. Evidence now suggests that the rise of Donald Trump, first as a candidate and now President-Elect, represents the latest and very clear manifestation of that resentment and suspicion. That's not just an impressionistic assessment. My recent research offers empirical support for it.

Understanding and Measuring Anti-Intellectualism

Earlier this year, I developed and administered a survey in which I tried to tap into the elements of anti-intellectualism that appeared to be rising to the surface in Trump's rhetoric.  Following Hofstadter's lead, I attempted to come up with a battery of questions designed elicit responses that indicated whether or not someone exhibited the resentment and suspicion he described.

However, one of the biggest criticisms of Hofstadter's analysis is that anti-intellectualism is a rather amorphous concept that can manifest itself in a number of ways.  25 years ago, Daniel Rigney, a sociologist at St. Mary's University dissected Hoftstadter's discussion of the socio-cultural roots of American anti-intellectualism and identified three separate, but interrelated dimensions:
  1. Populist Anti-Elitism – The belief that the values of intellect are, almost by definition, elitist in nature; that the educated classes are suspect, self-serving, and out-of-touch with the lives of “average Americans.”
  2. Unreflective Instrumentalism  – The belief that the value of education is primarily found in the immediate, practical end of job training, and spurns the more abstract notions of expanding one’s horizons and developing a deeper understanding of the human condition. 
  3. Religious Anti-Rationalism – The belief that science and rationality is emotionally sterile and promotes relativism by challenging the sanctity of absolute beliefs. 
As relevant as these dimensions may be, it seems to me that they make up an incomplete list, particularly in the modern political context that has evolved since Rigney's analysis. In particular, it seems that a suspicion of science and those who engage in it need not necessarily be rooted in the centuries old struggle between religion and science. As evidence of that claim, I bring up the research of yet another sociologist, Gordon Gauchat. In 2012, Gauchat documented the decline of public confidence in the scientific community over the past four decades, particularly among those identifying themselves as politically conservative. While he demonstrates that the lack of confidence in science is significantly correlated with religiosity (it's often not what religion people believe, but how much they practice that religion that matters, so we will often measure religiosity as frequency of church attendance), he also showed that it was fairly clear that such skepticism of science was not simply due to the fact that religion and science are often at odds with each other.

While opposition to such things as teaching evolution in public schools can logically be connected to religiosity, the same cannot necessarily be said about other issues where public perceptions are often at odds with the conclusions of the scientific community.  Battles over climate change and the safety of vaccinations and genetically modified organisms in food come to mind.  Opposition to the evidence and conclusions presented by the scientific community on these issues seem less likely to be due to religious objections but simply due to a related, but distinct, fourth dimension of anti-intellectualism:
  1. Anti-Scientific Skepticism - The belief that science, and especially those who practice it, are motivated by biases (political or otherwise) that render their findings and conclusions suspect, not on religious grounds but likely through a lack of scientific understanding, motivated reasoning or a combination of both.
From that basic framework, I developed a battery of Likert-type survey questions for each construct (In non-nerd speak: I presented them with statements like those presented below and then asked them to indicate on a 5 point scale ranging from 1 which meant they strongly disagreed with the statement to 5 which meant that they strongly agreed with the statement).  Examples of the items in each dimension are presented below:
A lot of problems in today’s society could be solved if we listened more to average citizens than we did to so-called experts. [Populist Anti-Elitism]

Universities and colleges place too much emphasis on subjects like Philosophy and the Arts and not enough on practical job training. [Unreflective Instrumentalism]

Often it seems that scientists care more about undermining people’s beliefs than actually solving problems. [Religious Anti-Rationalism]

Science has created more problems for society than it has solved. [Anti-Scientific Skepticism]

Anti-Intellectualism in 2016

With these questions and others like them, I created four anti-intellectualism scales (one for each dimension) by taking the average score across the items within each dimension.  I included these questions along with a series of other questions about the campaigns and the candidates running this year to a national sample of 1220 Americans from June through August earlier this year.

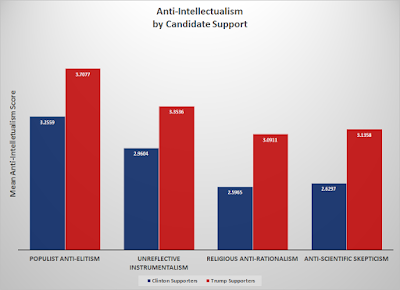
The results seem to confirm that Donald Trump's anti-intellectual/anti-establishment rhetoric appeared to strike a chord with a number of individuals. As the figure below shows, Trump supporters were significantly more likely than those supporting Clinton to hold anti-intellectual views on each dimension. (p < .001, which, in non-nerd speak, simply means that we can reasonably conclude that the differences we see here in the anti-intellectualism scores between Clinton and Trump supporters are real and not simply due to the fact that we only talked to 1220 people).


Using Anti-Intellectualism to Predict How a Person Will Vote

I took this a step further to see if we could use the anti-intellectualism scores to estimate the probability of supporting Donald Trump, while controlling for party identification.  To put it more simply: We know that Republicans are more likely to support Donald Trump than either Independents and Democrats. Does anti-intellectualism make Independents, and even Democrats, more likely to support Donald Trump? Are Republicans who score low on the anti-intellectualism scale less likely to support him than fellow Republicans who score higher?

To answer those questions, I did some (more) nerdy stuff. I ran a logistic regression with the vote intention question as the dependent variable and party identification and the anti-intellectualism scales as independent variables   Logistic regression is a statistical technique we nerds use when we want to see if certain variables (in this case a person's party identification and their anti-intellectualism scores) can help us predict what someone is going to do or say when they're given two choices.  In this case, those two choices were either saying they were going to vote for Donald Trump, or for Hillary Clinton. (Yes, I know there were other choices, but there weren't enough people in my survey who said they were planning on voting for Gary Johnson, Jill Stein, or someone else... so this works).

Simply put, it's basically a more rigorous test of the influence of anti-intellectualism on a person's decision about who they were planning on voting for than the figure above.  When I ran all the variables together as predictors of intended vote choice, only one of the anti-intellectualism dimensions ended up being a significant in addition to party identification: Populist Anti-Elitism.

The figure below shows how a person's party identification (whether they consider themselves a Democrat, Independent, or Republican) and their populist anti-elitism score effects the likelihood that they would indicate they were planning on voting for Donald Trump.  Each line represents people in each party identification category. As the lines move across the chart to the right, it indicates people with higher anti-intellectualism scores, and the higher the line is, the more likely it is that they will say they are planning on voting for Donald Trump.


As you can see, Republicans were much more likely to support Donald Trump than Independents, and even more so than Democrats.  That's not surprising; we would have expected that.  What's more interesting is the effect that anti-intellectualism has.  In all three groups (but mostly with Independents... just like we would expect), those with higher Populist Anti-Elitism scores were more likely to say they were planning on voting for Donald Trump than those scoring lower on the scale.

Simply put, anti-intellectualism mattered, even when we controlled for a person's party identification. Those exhibiting greater animosity and resentment towards those who are highly educated, were significantly more likely to support Donald Trump over Hillary Clinton.

Putting These Findings Into Context

So, what does this all tell us about what happened this election?

It perhaps gives us some insight into why many of the high-profile renunciations of Donald Trump we heard during the campaign seemed to have so little effect.  Newspaper editors, national security officials, former Presidents, government officials, and conservative and liberal pundits alike lined up in their vocal and detailed opposition to a Trump presidency over the course of the campaign. However, most of these appeals appear to have fallen on many deaf ears. Clearly, it seems that many of Trump's supporters felt they have lost their voice in the nation's political discourse (if they had it at all) and resent the way they've been talked down to, and about, by the "intellectual elite."

You may have seen memes circulating around the internet featuring a quote by noted science fiction author Isaac Asimov like the one below:


While it gets to the heart of Hofstadter's analysis of American culture that drove the research project I'm discussing here, this meme has always made me a little uncomfortable. Whether you agree with its sentiment or not, to those with less education it is likely to be seen as an arrogant criticism of "average Americans." It's an important lesson: If you want to convince someone that you have relevant and important information you feel they should know, insulting their intelligence is probably not the best way to preface your remarks. If they think you don't respect them, they're likely to return the favor.  It's probably why this survey item is so influential in my measure of Populist Anti-Elitism:

Highly educated people have an arrogant way about them.


The Obligatory Nerdy References Section

For the nerds reading this, or if you want to expand your nerdy credentials, here are the specific works I mentioned in this post:

Gauchat, Gordon. 2012. "Politicization of Science in the Public Sphere: A Study of Public Trust in the United States, 1974 to 2010." American Sociological Review. 77: 167-187

Hofstadter, Richard. 1963. Anti-Intellectualism in American Life. New York: Knopf

Rigney, Daniel. 1991. “Three Kinds of Anti-Intellectualism: Rethinking Hofstadter.” Sociological Inquiry. 61: 434-451. 

Sunday, November 13, 2016

The Trump Wave We Could Have Seen Coming (and sort of did)

Coulda, woulda, shoulda.

You may have noticed that this was a rough year for polling and election forecasting.

As I pointed out in my previous post, polls significantly under-estimated Donald Trump's level of support, especially at the state level.  As a consequence, the short range projections by a number of forecasters missed the mark and indicated that Clinton would likely win, and quite handily at that.

Of course, we know at this point that's not what happened.

The question that inevitably comes up in hindsight is, "What did we miss?"

The polling community is already trying to figure that out, at least from the perspective of how the polls could have been so wrong. But for those of us in the forecasting community who are dependent on the polls, that is of little consolation. Unless the data going into the model is accurate, whatever comes out won't be. Figuring out why the data was flawed still doesn't change the fact that we were wrong in our forecast.

But what if we could have seen the error coming? What if we had been able to incorporate that into our models? Would that have made a difference?

Well, as it turns out, there's evidence that maybe we could have seen it coming.  Not necessarily the structural failures in the polling itself, but the pro-Trump wave that the polling might have been missing.

I mentioned Helmut Norpoth in my previous post. Norpoth received a great deal of attention in the last weeks of the campaign for his forecast that showed Trump would win. He wasn't the only one. Alan Abramowitz is another forecaster whose model predicted a Trump victory. Many have pointed out that both Norpoth and Abramowitz were technically wrong in their forecasts because they predicted that Trump would win the popular vote, and Clinton is likely to be the popular vote winner.  Even so, their forecasts pointed in a direction that very few others did.

So, what did their models do that others' didn't?  All three (Norpoth has two: one that came out with a forecast not long after the 2012 election, and another that generated its forecast in Feburary) have a very basic premise: It's just difficult for a party to hold on to the White House for a third consecutive term.

In my previous post, I mentioned another model that I created last year that also showed a potential Trump victory. Unfortunately, for reasons I explained in my previous post, I set it aside in favor of the one I've been using with Tom Holbrook for the last 4 elections. One key difference between the two is that the one I came up with also models what Abramowitz has called the "two-term penalty:" Support for the incumbent party just automatically goes down after two terms as people are more likely to desire change.

What that tells us, or should have, is that there was likely a core of increased support for the Republican candidate despite what the polls showed. Many of us refused to see it.  Abramowitz doubted his own forecast because of what he called the "Trump effect." To be sure, there does appear to be some evidence that Trump under-performed what another Republican might have been able to do. That may help explain why he failed to win the popular vote despite Norpoth and Abramowitz's forecasts that he would.

It got me thinking, what if we tweaked our model?  What if I added a variable for the two-term penalty just like I'd done in my Long-Range model? Would it have made a difference?

Yes... somewhat.

If we had used this model to forecast the outcome in place of our usual September model, we still would have gotten the outcome wrong, but it would have been much closer to what actually happened.  The table below shows the side-by-side comparison of the two projections, along with what will likely be the actual outcome (according to the unofficial results as they've been reported on November 13).

Original
Model
ACTUAL
OUTCOME
Revised
Model
ClintonTrumpClintonTrumpClintonTrump
Two-Party
Popular Vote
52.1%47.9%51.1%48.9%51.0%49.0%
Error
+1.0%
-1.8%
-0.1%+0.1%
Electoral
College Votes
326212232306278260
Error
+94
-94
+46-46
Clinton Win
Probability
91.2%68.1%

As you can see, this simple adaptation of the model would have generated a more accurate prediction of the national popular vote, coming within 1% of the actual result. As the official results get reported, we may very well find that the projection from this new model might even be closer. We still would have gotten the Electoral College vote incorrect because it shows Clinton winning more than 270 Electoral Votes, but it would have been closer to the actual result and the associated win probability would have been a more accurate representation of how close the election actually turned out to be. [Edit: The table has been changed to show the official results, which shows that both the original model and the revised model were very close to the actual popular vote result.]

This still shows that the model is quite vulnerable to the pervasive error that plagued the polls this year, but with a simple addition we could have at least moderated some of its effects. It suggests there was support for Trump out there that the polls simply didn't catch, and that support was at least somewhat predictable  Once the official results come in, we'll most likely regenerate the model with the new adaptation and will use it to generate our forecast for 2020.  With the Republicans defending just a single term that year, it won't have much of an effect. The first true test of this new model will come in 2024 at the earliest.

Come back then. I'll still be here, looking at numbers, because it's what I do.

Thursday, November 10, 2016

On the (Dis)Comfort of Numbers

I love numbers. I guess that's obvious given the title I chose for this blog.

Politics is a subject that is laden with subjectivity. People have their biases, and when they engage with the world they view it through the lens of their biases.  When there are political discussions, especially online, they often devolve into over-simplified presentations of the opposing point-of-view and discounting them as simply the product of blind bias.  That latter part may be true most of the time, but it isn't always.

But that's why, as a Political Scientist I take comfort in numbers. It's why my Political Analysis course is my favorite course to teach. It's why I started this blog to try and explain to people who don't work with numbers what they can tell us about the political world.

Numbers are solid. Numbers are certain. Numbers can tell you things you would not otherwise know. Numbers can provide a sense of confidence in a position, or course of action.

Unless, of course, the numbers are flawed.

And that certainly seems to be the case with the polls leading up to the election on Tuesday.

Yes, the polls got it wrong.

And as a consequence, election forecast models, like ours, that relied upon the polls got it wrong.

As it turns out, national polls carry very little weight in our model, but state polls are quite important. - TPDN


I'll leave it up to those inside of the polling industry to figure out how they got it wrong and why, and I have confidence that they will.  The allegations that I saw hurled in the run-up to the election that pollsters were biased and deliberately cooking the numbers to show Clinton had more support than she really did are, simply put, ill-informed.

But it would also be wrong to say that those of us who work with numbers are unbiased.

We have biases, but they're not necessarily the one that people accuse us of.

I've been forecasting elections for many years now. Ours was actually one of the first to do what many of the most well-known models do now: generate a state-by-state Electoral College prediction. We first used it to generate a forecast for the 2000 election.  Like this one, that was an election that most of us forecasters got wrong.

But that was a different time. Election forecasting was a purely academic exercise within a relatively small corner of Political Science. Even within the discipline it was viewed by many as not really "science." I had colleagues question whether a publication I had in which we first presented our forecast model should even be considered "research."

My response then, as it still is today, was that it most definitely is scientific research. It is an attempt to apply the principles we've learned from decades of empirical Political Science research in an applied way. We're testing the explanations of voter behavior that we've gotten from that research to see if we can then predict what voters can do. Explanation and prediction are at the core of what science is all about.

So, getting the 2000 forecast wrong was a learning experience. Personally, it was humbling. I'd gone out on a limb: I'd publicly said what I thought was going to happen, and it didn't.

But it happened in a relatively small space. I announced our forecast at a small gathering of students and faculty at the small and relatively unknown regional state university where I worked at the time. It was a relatively low-risk move. Humbling, but not very embarrassing.

Tom Holbrook and I saw it as an opportunity to go back to the drawing board, as did all of the other forecasters who got 2000 wrong.  It offered up more data for us to make our models better, and we did.  We took that data, revised the model, and used it to generate an extremely accurate forecast in 2004, missing the national popular vote by less than half a percentage point.  Even so, there were issues: We got three states wrong. So we went back to the drawing board again to make it better.

We got the next two elections right. In 2008, we under predicted Obama's level of support somewhat, and we got two states wrong. Indiana and Virginia.  That was a reasonable amount of error, we figured, but we took the data, updated the model, and moved forward.  In 2012, we were near perfect, getting all 50 states correct in the preliminary forecast based on September data, but getting Florida wrong in the final Election Eve forecast. (We felt somewhat vindicated by the fact that it took Florida a few days to finally decide). We missed the popular vote by just over 1% in the September model, but by just under that with our final projection.

Even so, we made a minor adjustment (which, as a side note, wasn't the reason why we got it wrong this time. In fact, we would probably have been off by even more had we not made that adjustment), and went into 2016 with a great deal of confidence. In our tests of the model and seeing how it would have worked if we'd used it for previous elections, it was our best yet.

That confidence, of course, proved to be unfounded.

We didn't just get it wrong. We got it wrong by a lot.

We over-predicted Clinton's share of the popular vote by 2% and got 5 states wrong in our September forecast. We were even worse than that with our Election Eve forecast, getting six states wrong and missing the popular vote by an even wider margin. When the final analysis comes down, I won't be surprised if ours ends up being the worst performing.

We were right back to where we were in 2000.  But, of course, things are different now than they were back then.  Election forecasting is no longer a quaint cottage industry in Political Science. Thanks to folks like Nate Silver popularizing it, it's now a much more public "game" and we've seen an explosion in the number of models all trying to predict the outcome.

Compared to 538, New York Times Upshot, The Daily Kos, The Princeton Election Consortium, and the Huffington Post, Tom and I are relatively unknown outside the little election forecasting community in Political Science. Even so, our miss was more public this time compared to 2000. There's this thing called the internet that is much more ubiquitous now than it was in 2000, and I worked to try and get our model noticed. (In retrospect, maybe I should have been more quiet) But even so, we've not experienced anywhere near the level of vitriol and ridicule that others have seen. Natalie Jackson, the Political Science Ph.D. at Huffington Post has had the bear a good deal of it and it just sickens me.

A Tweet to Natalie Jackson, forecaster at Huffington Post... WTH?
For the first time since 2000, I made a public presentation of our forecast on the day that it came out. It was to a somewhat larger group of students and faculty than the one I had in 2000, and the local press was there as well. I was on public record with our prediction more than with any other election.

The numbers failed us, and the failure was more public this time.

Our model relies very heavily on polling data, and the polls were quite a bit off this time. As I stated before, I'll leave the polling post-mortem to the pollsters. I've done polling, but I don't consider myself a pollster by any stretch of the imagination. So I'll let the people who do it figure it out, because they know better than I do about what went wrong and how to fix it.

For Tom and I, we'll adjust like we always do. Science moves on, and failures are an opportunity to learn and improve. I've already got some ideas of what we can do to make the model better because, as it turns out, I think the polling error we saw might actually be predictable for reasons I'll save for another post. I look forward to diving into the data and figuring it out.

But for me, right now, this failure is more personal. I had friends and colleagues who were, and are, incredibly worried about the outcome. They trusted me to tell them what was going to happen; to give them assurance that, to them, the "unthinkable" wasn't going to happen.

My bias in this is, and always has been, in getting the forecast right.  It's not ideological. I don't push a forecast because it predicts what I want it to predict. I push it because I have confidence in it.  The numbers showed a Clinton win, and they showed it pretty convincingly.  The reports are now that even those inside the Trump campaign were preparing for a loss because their internal numbers showed them the same thing.

But our numbers were more than just numbers to a lot of people.  They provided certainty and comfort. All of a sudden, I became much more than scientist working with numbers. I'd become a counselor, listening to people's fears and anxieties, and attempting to comfort them with the numbers I'd come to trust.

It was a role that I was not entirely comfortable with.  Not because I didn't have confidence in the numbers, but because... WHAT IF we were wrong? I was going to let a lot of people down. They were trusting me, but I knew I couldn't control the outcome. I could only tell them what the numbers said.

My discomfort reached a high point when Nate Silver's win probability started to diverge significantly from the rest of the pack a week or two before the election.  Perhaps unbeknownst to most outside the forecasting community and those who follow it closely, a rigorous debate ensued about methodological issues, and what the win probability represents, and what we should actually infer from it.

For the most part, I stayed out of the fray.  I had our numbers and I had confidence in them. But I really couldn't deny the methodological soundness of some of the arguments that Silver was making. But by that point, I was set in my role as Election Therapist and I knew that if I openly acknowledged the growing uncertainty, that was going to upset a lot of the people who had been relying upon me for comfort. I took on their anxiety for them.

That was really stupid.

I'd let biases get in the way of scientific objectivity. Still, though, the bias wasn't ideological. It wasn't because I wanted Clinton to win and, therefore, want to push that narrative. A good part of the bias was simply because I knew friends and family were going to be upset if she didn't. They were worried and I didn't want them to worry more.

But beyond that, and enabling it, was the bigger bias was towards the numbers and the confidence I had in them. I had a sound, empirical reason to believe our numbers were right: they'd been right before and they were numbers that were similar to those that many others had as well. I even privately consulted with other forecasters asking how they felt about it.  The shared my same level of concern that projections might be a bit too bold. But there, in the end, was validation.

I took comfort in the herd.

Of course, now we know that comfort was ill-placed, and hind-sight is 20-20.  But now that the dust has settled I can see that there were signs that I missed simply because I took comfort in the numbers of the herd.

You see, Tom's and my forecast isn't the only one I do. A year ago, I developed another one on my own. It's partly based on the one we use, but it was an attempt on my part to push the envelope as far as the forecast lead-time was concerned.  One of the drawbacks to our model is that it has a comparatively short lead-time: because of the limitations on the availability of the data for the variables we use, ours comes out just one month before the election.

To the consumers of popular election forecasting that's probably not that big of a deal, but to those within the academic forecasting community it is.  Most models in the political science and forecasting literature come out two or three months in advance, others are even longer.  So, in that regard, ours comes pretty late.  What I was really interested in was to test how far I could push it, so I started putting a model together in the Fall of 2015, and called it my "Long-Range" model.  It was pretty simple, but it was unique in that it did something no one else did: Generate a state-by-state Electoral College and Popular Vote forecast a year before the election, months before we even knew who the nominees were. If you're interested, you can look at it here: State Electoral Histories, Regime Age,and Long-Range Presidential Election Forecasts:Predicting the 2016 Presidential Election

I presented the first prediction from it, which I updated monthly after that, at a small conference at the end of October: The Iowa Conference of Presidential Politics.  The conference was so small that my presentation was made to an "audience" five people, all sitting around a study table in the Library Reference Room at Dordt College in Sauk Center, Iowa.  The audience was comprised of mostly other academics who were also there to present a paper, none of which were forecasting papers.

That first prediction showed a strong likelihood that the Republican candidate would win. Given that the nominations hadn't happened yet, I had to generate a matchup matrix of possible candidates.  Here is that first matrix:

You can see that it indicated potential trouble for the Democrats, no matter who they nominated. When you look at the matchup between the two eventual nominees, it showed a very close race, but one that Donald Trump had a 75% chance of winning.

The comments I got from the discussant and the rest of the audience were incredulous:  "Donald Trump?  Really? How could that be? He doesn't even have any experience," they said.  Similarly, I had colleagues who scoffed at the finding that Ben Carson had the best chance of winning.  Mind you, this was not projecting who would win the nomination, but just who would win if they did win the nomination. I was equally incredulous but I still, like many, figured it would likely be Bush or Rubio in the end.

Nonetheless, I continued to generate my monthly forecasts whittling down the matrix as candidates dropped out.  The final forecast that I presented at the American Political Science Association Conference in September gave Trump a 93.8% probability of winning.  It, too, was met with smirks.

Why? Because at that point the consensus had pretty much built up among forecasters that Clinton was going to win. Even those who had models that predicted a Trump victory hedged a bit, some offering explanations of why they were probably going to be wrong.  

I followed the comfort of the herd.

I had a strong methodological reason to do so. There is strong research that shows that the herd is usually right.  If my model was wildly out-of-step with the herd, which this certainly was, I was probably wrong, I figured.

So when the end of September came, I set aside the Long-Range Forecast and focused on the tried and true one that I had been using with Tom Holbrook for years, and on October 3 I announced to the University community and to the local press that Hillary Clinton had a 90% probability of winning the election.  I was comfortable with that.  I was well within the herd and my Democratic friends were relieved that I'd stopped saying that Trump was going to win.  Some of my Republican friends weren't happy, but they didn't really challenge it because I think many of them believed he wouldn't win either.  I think many resigned themselves to the idea that Clinton would win, and outcome expectation polls, which have been shown to be highly predictive of the outcome in the past confirmed that belief. Furthermore, let's face it, I live in Utah. This isn't really what one would consider "Trump Country." Most of them didn't want Trump to be President either.

But of course, the numbers, the expectations, and the herd proved to be wrong. The forecasters who got it right, notably Helmut Norpoth and Alan Lichtmann, preserved their decades long streaks of getting it right with their models. I'd been asked about them in the weeks leading up to the election. I dismissed them as outliers.  Their streaks were about to be broken, I said, because the data clearly pointed in another direction. If I'd had more faith in myself, and in the numbers from my Long-Range model, then I would be writing a very different post here.

But I take this now, as it should to all who rely on data, as a simple but important reminder: 

Sometimes the data, and the herd, can be wrong.  

Nate Silver was right. He got his forecast wrong like most of us did, but he was absolutely right to point out that there was a lot more uncertainty in the numbers than many of us were saying. It's something that those of us who work with data need to remember: the result is only as good as the data that goes into it. It is incumbent upon each of us who do this to hold onto a healthy respect for that fact as we go back to the drawing board, figure out what went wrong, fix it, and try again.

Just like we always do, because that's how science works. And leave the therapy work to therapists.

Tuesday, November 8, 2016

The Paths to 270 - What To Watch on Election Night

The day is here. Now we get to see if all the speculation and data crunching we all went through actually gave us an accurate picture of the eventual outcome. As you watch the election results this evening, the real question is "When will we know who will win?"

That's difficult to say for certain, but at least you can get a sense of what results will give us an indication of what is going to happen as the night goes on.  I've tried to lay out here what I think are the most likely scenarios based on our forecast, and when we'll start to see indications of whether or not it's going to go the way we think it's going to go.

The table below lays out the Electoral College landscape based on the state win probabilities generated by the latest run of Tom Holbrook's and my election forecast model.  It presents what our model suggests are the most likely paths that either Hillary Clinton or Donald Trump will need to take in order to get to the to the 270 Electoral Votes necessary to win the presidency.  Things have not changed significantly since my last post, so Trump's challenge remains significant.

The states are arranged in order of the probability that the model predicts that they will be won by Secretary Clinton.  Based on these results, it is easy to see that Donald Trump's path to 270 is a little more challenging than that for Hillary Clinton.  The model suggests that Colorado is the key tipping point state, the state that will put either candidate over the top in the Electoral College.  The good news for Hillary Clinton is that the model suggests she has an 85.2% probability of winning that state.  The model suggests that if she can win there, she can win the White House even while losing I'm calling The Key Six battleground states of Florida, Iowa, Nevada, North Carolina, Ohio, and Virginia.

For Trump, however, his options are a bit more limited. Not only does he need to win all the states that the model projects he will win but also six states the model suggests will be won by Secretary Clinton.  If Trump loses just one of these states, his chances of winning become substantially more difficult.  To win the election, then, he would have to pick off states that the model suggests are more firmly in Clinton's column.

States to Watch, and When

7:00 PM EST

Polls in New Hampshire, and Virginia close at this time, and they may give us an early indication of how the night will go. We've got Virginia at a 91% probability of being won by Clinton. If it is close and drags long into the night it will suggest that the model may have significantly underestimated Donald Trump's level of support and could spell real trouble for Hillary Clinton.  

New Hampshire is an interesting piece of the puzzle.  We give Clinton a 91.6% probability of winning the state (and we've never had a state prediction be wrong when its probability has been over 90%), but recent polls there suggested that it might be closer than it had been earlier.  If it turns out the model is wrong and Trump actually wins New Hampshire, it could also open up more opportunity for him to win.  Without New Hampshire, Clinton would need to not only win Colorado but another state in the gray zone, while not losing any of the other states we are considering to be likely in her column.

On the flip side, Georgia could also be an early indication.  We give Trump an 87.6% chance of winning there, but it had been discussed a few weeks ago as creeping in Clinton's direction.  It doesn't look like Clinton will pull off an upset there, but like Virginia, if it ends up being too close to call for very long tonight, then it may suggest that Clinton may have an even larger victory than we are expecting.

7:30 PM EST

When the polls close in North Carolina and Ohio, we should get a very good indication of what Trump's chances of winning will be.  We have both of them in Clinton's column, but only marginally so. According to our model, these are two of the states from The Key Six in the gray zone that Trump has the greatest chance of picking off.  If he can pick up BOTH of them, his chance of winning go up significantly.  Look to see if they are early calls in either direction.  I don't expect them to be, but if they are, it's really good news for whoever it is for. Trump has a slight edge in the Ohio polling average we use for our model, but Ohio's history and Clinton's lead in the national polls keep it ever so slightly in her column for us. So it, for us, is truly a tossup.

8:00 PM EST

Polls in all the of the counties in Florida will close at this time, as do Pennsylvania and and Michigan.  Without Florida, it's hard to see how Trump gets across the finish line unless he wins both Michigan and Pennsylvania.  We've got Clinton winning all three, but Florida is expected to be close as it always is.  Trump hit Michigan and Pennsylvania hard at the end, and polls have been tightening in both states, moreso in Michigan. Don't expect Florida to be called early.  But if Michigan and Pennsylvania do, they will most likely be called for Clinton and that is very bad news for Trump because it will likely mean that his "Rust Belt" strategy will fail, in which case he will NEED Florida.

9:00 PM EST

Colorado and Wisconsin will be key at this time. We've got Wisconsin firmly in Clinton's column at 93.9%, but it could be Trump's last gasp at a Rust Belt Strategy, especially if he loses Florida.  But he's winning in Wisconsin, he's probably also got Florida in hand as well.  Colorado is the bigger question.  As we pointed out, it's the tipping point: the key state that gets Clinton to 270.  That, of course, assumes that she gets all the other states we give her a higher probability of winning, especially Michigan and New Hampshire.  If we're still waiting to see what Colorado will do, that's probably good news for Trump.

Arizona could also be a sleeper here as well. We've got it in Trump's column, with a 79.6% probability of him winning there. But it's gotten some attention for being a red state that Clinton could win. I don't expect that to happen, but look to see what happens here. If it takes a while for a call to be made here, that could be an indication of a Clinton landslide. Even so, we'll probably see indications of that being true even before then, especially if Georgia goes her way earlier in the evening.

10:00 PM EST

Iowa and Nevada are the last of The Key Six to close. We've got Clinton winning both, but Iowa is the one that is the most in doubt. Trump had the slight edge in the polling average there but, like Ohio, our model gives the edge to Clinton due to the history and national poll variable. A bigger issue will be Nevada.  It's possible that we'll already know by the time the polls close in Nevada if Trump can get to 270, but if not, it could be key.

Clinton Clinton Win
Probability
Trump
State Electoral
Votes
Cumulative
EV
Cumulative
EV
Electoral
Votes
State
DC 3 3 100%
Vermont 3 6 100%
Hawaii 4 10 100%
Massachusetts 11 21 100%
California 55 76 100%
New York 29 105 100%
Maryland 10 115 100%
Rhode Island 4 119 100%
Illinois 20 139 100%
New Jersey 14 153 100%
Connecticut 7 160 100%
Delaware 3 163 100%
Washington 12 175 99.9%
Maine 4 179 99.8%
Oregon 7 186 99.6%
Michigan 16 202 97.7%
New Mexico 5 207 97.1%
Minnesota 10 217 96.9%
Wisconsin 10 227 93.9%
Pennsylvania 20 247 92.6%
New Hampshire 4 251 91.6%
Virginia 13 264 91.0%
Colorado 9 273 85.2% 274 9 Colorado
Nevada 6 279 76.1% 265 6 Nevada
Florida 29 308 69.7% 259 29 Florida
Ohio 18 326 56.5% 230 18 Ohio
Iowa 6 332 54.1% 212 6 Iowa
North Carolina 15 347 51.2% 206 15 North Carolina
  20.4% 191 11 Arizona
  12.4% 180 16 Georgia
  4.1% 164 10 Missouri
  2.1% 154 11 South Carolina
  0.5% 143 9 Indiana
  0.3% 134 38 Texas
  0.1% 96 6 Mississippi
  0.1% 90 3 Alaska
  0.1% 87 11 Tennessee
  0.0% 76 8 Louisiana
  0.0% 65 3 Montana
  0.0% 65 6 Kansas
  0.0% 59 3 South Dakota
  0.0% 56 6 Arkansas
  0.0% 50 9 Alabama
  0.0% 41 8 Kentucky
  0.0% 33 3 North Dakota
  0.0% 30 4 Nebraska
  0.0% 25 5 West Virginia
  0.0% 20 6 Utah
  0.0% 14 7 Oklahoma
  0.0% 7 4 Idaho
  0.0% 3 3 Wyoming

Tuesday, November 1, 2016

Trump's Mount Everest

With just one week remaining until the election, the forecast model that Tom Holbrook and I developed 17 years ago has now given Hillary Clinton a 99.5% probability of winning.

In light of the news of FBI Director Comey's letter to Congress last week, you might think that probability to be a bit high, but the data really do support it.  Simply put: At this late stage of a campaign, most voters minds are made up and there is not much that will move them. In the initial polling data that has come out since the news of Comey's letter broke, there has been very little movement to suggest it will have much impact on the outcome.  That's why our forecast, based primarily on polling data, is highly predictive of the outcome this close to the election.

Making matters worse for Donald Trump is that Hillary Clinton has solid leads in a large number of states... states that he needs in order to win. And that makes Trump's run for the White House an incredibly difficult climb.

Our model generates state-level predictions that we can use to determine the likelihood that a candidate will win the state. It's a simple principle: the larger the lead we project a candidate to win by, the higher the probability that they will actually win it. So, the real question turns to which states Clinton and Trump are most likely to win.

In past elections, we have found that when candidates are projected by our model to win a state by at least 6% they end up winning it... every single time.  That translates into a state win probability of at least 90%. At this point in the campaign, we've never had a candidate lose a state when we've given them at least a 90% chance of winning.  The highest was Indiana in 2008.

In that year, one week before the election our model gave John McCain an 84% chance of winning Indiana. Barack Obama pulled off a surprise victory there on his way to winning the Presidency.

And therein lies the problem for Donald Trump.

If we assume that a candidate will win the states where our model gives him or her a greater than 90% chance of winning, you can then see why the probability that we have for Hillary Clinton winning the election is so high.

Below is the map where we've automatically awarded states to the candidate who has a greater than 90% chance of winning.


If we allocate the Electoral Votes from theses state to the candidate we expect to win them, the totals are:
Hillary Clinton - 264 
Donald Trump - 164

Given that a candidate only needs to get to 270 in order to win, Trump's path to 270 is very, very narrow. Simply put, he needs to win all 8 of the remaining states in order to cross the finish line first. That is a monumental task indeed, especially given the fact that our model is currently projecting Clinton to win 6 of them.

She only needs one.

Of the gray states on this map, the one with the highest win probability is Colorado. Our model gives Hillary Clinton an 87.4% chance of winning the state. If Clinton wins Colorado as our model projects, she wins and Donald Trump loses.

If she wins any of the other states, she wins and Donald Trump loses.

According to our model, Donald Trump has one path to victory, and it just barely gets him across the line. Hillary Clinton has many paths.

It's simple math, and that's why Donald Trump's climb to the White House is the equivalent of climbing Mount Everest, and that is why we're giving him a less than 1% chance of succeeding.